by Sara Vaca
 Evaluation is a vast field of designs and methods in continuous development. The numerous parameters and choices associated with different methodological options can be difficult to fully understand without deep study and desk review.
The motivation for the Periodic Table of Evaluation was to create a one-pager visual that catalogues methodological options and parameters involved in an evaluation design.
Background and Motivation
The first time I came across infographics as a language was on Twitter (now X) in 2011. At the time, I was looking into infographics on various topics, including the evolution of rock music genres, mapping of the main consumer brands and the company who owns them, or 13 reasons why your brain likes infographics. Ever since, I have been fascinated (read slightly obsessed) with learning, using, and sharing this visual language that resonates so much with me and with the way I understand and learn. So, I started playing with visuals in every dimension of my life (using them to do visual CVs, transforming food recipes into visual representations, and visualizing the rules of a board game) and of course in my work.
When I started my M.A. in Evaluation in 2012, I gave myself the challenge of doing all the homework in a visual way. And so started my work explaining evaluation visually (www.lovingclarity.com/catalogue/). Moreover, thanks to the master’s program, I became aware of how there was no such thing as the gold standard (formerly thought of as randomized controlled trials), but the centrality of the better-adapted-to-each-context methodological choice in evaluation, as the main source of rigor. Reflecting on the methodological choices in evaluation made me wonder if I really knew the whole range of available tools, methods, approaches, you name it, in evaluation. And that idea (could I list a catalogue of evaluation choices?) stayed in my head.
So, I first started listing all the different methodological choices I was aware of in the different categories of the relevant parameters in evaluation: Choices related to paradigms, approaches, criteria, methods, and so on. The list included the following categories:
-
-
- Paradigms (commissioners). I started with paradigms, the way we understand the world and how we think we can apprehend it, because it shocks me how important yet unspoken paradigms are in evaluation practice.
- Then I added focus in the sense of a lens, as glasses through which you can look at reality and make sense of the world.
- Thirdly, I listed the approaches or different things evaluations can focus on or particular ways of doing evaluation (if I had to redo the catalogue now—or perhaps for the next version—I would merge these and lenses).
- Evaluation questions. Despite the unanimity I kept seeing in evaluation questions (mostly guided by the DAC), a key parameter in an evaluation is the potential evaluation criteria.
- Logics and rationales. Next, I listed the different logics or rationales I have heard about to evaluate Impact (which always makes me wonder why we are not as explicit when evaluating other criteria).
- It was mandatory to list the different methods used for collecting data (I didn’t think of data analysis methods at that time).
- Then I realized that evaluations could have a limited number of objectives (what they want to achieve as results).
- And that evaluations are conducted with a limited number of potential purposes (why they are motivated and commissioned).
- Paradigms (evaluator). Finally, I realized that my paradigms (the evaluator’s team’s) were as important as the commissioners’, so I included them too.
-
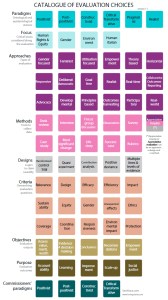
Once I had the list of evaluation choices, I tried to visualize them by placing each choice in a square colored by category (I don’t like lists). Technically, it became a special type of matrix, where the type of choice was given by its position, reinforced by colors. The chosen palette had no particular meaning beyond trying to look attractive and within a certain colorful aesthetic harmony.
This resulted in the first version of the Catalogue of Evaluation Choices, where I listed the main options classified by nine categories (Figure 1). I shared the visual in my personal blog, where I also post my other visual ruminations, and people who saw it seemed to like it.
Figure 1. Catalogue of evaluation choices (first version)
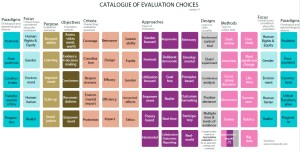
Some weeks later, I saw a periodic table of dogs or something similar. There are many funny versions: Periodic Tables of vegetables, cocktails, tables, or even swear words. And I decided to revise the Catalogue of Evaluation Choices into what would soon become the first version of the Periodic Table of Evaluation Choices.
Figure 2. Catalogue of evaluation choices (second version)
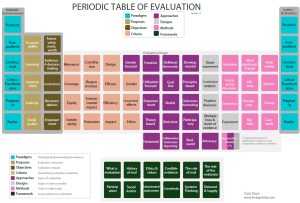
Once in this format, I realized that paradigms either of evaluators or commissioners were the same category, why they could (or perhaps even should) have the same color. Also, I arranged the boxes slightly differently to make the visual resemble the original Periodic Table of Elements. Figure 3 presents the first version of the Periodic Table of Evaluation Choices.
Structure and content
The Periodic Table of Evaluation Choices categorize the evaluation choices according to:
-
-
- Potential paradigms that the evaluators and the commissioners bring as identity and as a way of understanding the world, the program, and the evaluation: Positivist, post-positivist, constructivist, critical/transformative, pragmatist, and realist are examples of paradigms.
- Potential purposes of evaluation: Accountability, learning, improvement, scale-up, and social justice.
- Potential objectives of evaluations: Assessment of value, merit, and worth of programs, evidence for decision-making, conclusions, recommendations, and lessons learned.
- Potential criteria or groups of evaluation questions: Relevance, coverage, equity, sustainability, coordination, responsiveness, impact, environmental impact, protection, design, efficacy, efficiency, gender, unexpected results, and ethics.
- Potential approaches or lenses through which look at the evaluation: Gender-focused, feminist, utilization-focused, empowerment, theory-based, horizontal, deliberate-democratic, goal-free, realist, real-time, collaborative, outcomes reporting, developmental, principles-based, outcomes harvesting, participatory, real-world, advocacy, and appreciative inquiry (can also be viewed as a design or a method).
- Potential designs, usually meant as the rational to use for evaluating impact criterium (although each criterion has their own design, also not often discussed): Experimental, quasi-experimental, contribution analysis, positive deviance, and multiple lines and levels of evidence.
- Methods: Interview, focus group discussion, observation, most significant change, life story, success case, big data, desk review, rubrics, survey, and case study.
- Framework (other important central or surrounding issues involved in evaluation): What is evaluation, history of evaluation, ethics and values, credible evidence, role of the evaluation, role of the evaluator, participation, social justice, unintended outcomes, complexity, systems thinking, as well as demand and supply.
-
As mentioned earlier in this article, colors help to map the categories. The position of each choice within a category is defined to make the visual resemble a periodic table but has no real meaning.
Figure 3. Periodic table of evaluation choices (first version)
This visual, initially shared in my blog first and later presented as a poster at the 2018 European Evaluation Society conference, was well received, and to this day I receive feedback from fellow evaluators using it for teaching and conferences (as just one example, it has recently been granted permission to be translated in Japanese).
Intended Purpose and Use
The initial intended use of the Periodic Table of Evaluation Choices was to serve as a “cheat sheet” for evaluators: A quick overview of all potential choices when you study evaluation, when you elaborate Terms of Reference (ToR), or when you work on an evaluation design. It was also intended to serve as a reminder to myself of all the methods, tools, approaches, and so forth, that I would need to master (or at least know about) to be able to use them if an opportunity that would benefit from it arrived. Ultimately, the visual can be used to depict the parts of the evaluation design that are up to negotiation between commissioners and decision-makers when making choices about the evaluation design. Speaking directly to this type of use, the following version of the table depicts what is usually up for discussion in designing a commissioned evaluation (color-coded in orange).
Figure 4. Periodic table of evaluation choices (third version)
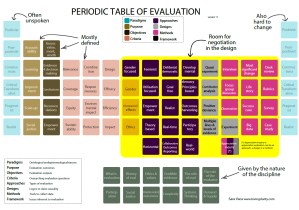
I realized that during evaluation design “negotiations” between evaluators and commissioners, some categories are defined by the evaluation needs themselves (the purpose, objectives, and even the criteria), while the influence evaluators or other actors can have in the design is limited to approaches and methods. I often suggest Gender Equity (and Human Rights) as an extra criterion to add when the ToR does not include it, for example.
Other elements such as paradigms are paramount for successful negotiations. For example, if commissioners are placed in a transformative activist paradigm and evaluators see reality in a positivist way (or vice versa), it will be challenging for the evaluators and commissioners to agree on an evaluation design. Despite their central role and importance in designing an evaluation, paradigms are hardly ever mentioned, much less openly discussed. For this reason, I wanted to bring attention to this issue. If nothing else, as a reminder of our limited self-awareness about our inherent bias.
Benefits and Limitations
I am proud of the Periodic Table of Evaluation Choices because using a familiar framework summarizes many of the diverse and wide parameters involved in the science and art of designing an evaluation. I know some people have printed it in big format and use it as a poster. Others have used it for teaching evaluation design. However, the main benefit I see is to have a quick overview of options, for those defining Terms of Reference for evaluations, crafting evaluation designs, or students who approach the discipline in an academic fashion. Having a complete enough framework that summarizes the many diverse options can provide confidence on how design choices have been thoroughly reflected on, selecting the most relevant ones for each evaluation context, instead of choosing from a limited number of “known” options.
The Periodic Table of Evaluation Choices also has limitations. The first one is that it is difficult (perhaps impossible) to make the table exhaustive. Though it will never be an exhaustive repertory, I would like to elaborate on the content in a second version, provide a more complete set of choices within each category, and perhaps even include other categories of choices (such as sampling options). For now, the current version already covers many of the main possibilities within the evaluation discipline. The second limitation is that making the list of evaluation choices available is a first step, but not enough to be able to include those possibilities into your evaluation design. I am working on explaining the differences and uses of each choice within each category, creating a series of infographics that summarize each category or in some cases (e.g., an approach) an infographic for each choice within each category.
Concluding Thoughts
Ultimately, what I would love to see is a Visual Revolution. I would like to see papers, books, and evaluation reports include good quality summary visuals that grasp the key messages for people who are busy and for people who struggle getting meaning from long texts like me.
I will continue to visually explain (to myself first and at the same time to others) evaluation and related contents. And to publish again many of the visuals I have created over the years and new ones to come, as it helps me to learn and to become a better evaluator and to share this passion of mine with others – and also because I have so much fun doing so.

Sara could you send me a pdf with your version 3 – I have used your previous version in training. Ian ian.goldman@wits.ac.za
Sara, great table!! Where did you originally publish this table? What is the best way to reference it academically? You said something about 2017 in the video… tks
Hello, I love this visualization and I am thinking about making it a poster above my desk. Could I possibly get a PDF version? Thanks